")


Coronal holes (CH) are reduced brightness regions in solar disk images in extreme ultraviolet (EUV) or soft x -ray emissions corresponding to configurations with open magnetic field lines. Data on their area and depth depth depression are used in solar wind parameter forecasts near Earth.
Regular two-dimensional observations of microwave with a 10-20 spatial resolution“ It began in the 1990s at frequencies of 5.7 GHz (SSRT) and 17 GHz (NORH). To 5.7 GHz, there was usually a bright temperature depression in Chs to 8 · 103 K with a quiet sun shine temperature 16 · 103 K. at 17 GHz, the contrast between CH and the quiet sun is imperceptible, but in many cases sources of increased radio brightness inside and in the limits of ch. Several reasons for the appearance of such heterogeneities have been discussed to 17 GHz: 1) microflarios in the chromophical network that leads to the release of energy in the CH Bases; 2) Concentration of magnetic field lines open on the chromosphere, which correspond to its greater divergence in the crown.
The purpose of this work is to analyze Multiwave CH’s observations with the Siberian radio heliographer. We have examined the characteristics of the microwave structures within the lim limits observed in the emission of EUV in the central part of the solar disc on April 25 and September 20, 2023.
Observations
The full solar disc maps on April 25, 2023 obtained with the Siberian radio heliographer [Lesovoi et al., 2017; Altyntsev et al., 2020] A ~ 06:14 ut. Radio maps were automatically built in routine mode at 20 frequencies from 2.8 to 9.4 GHz with a signal accumulation time of 4 s at each frequency. To reduce noise, we also averaged images obtained at adjacent reception frequencies.
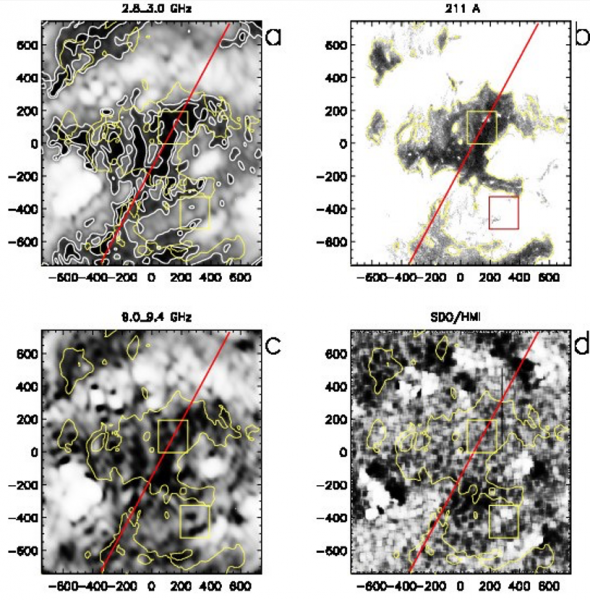
Figure 1. The microwave maps were averaged at frequencies of 2.8 GHz and 3.0 GHz (A), 9.0 GHz and 9.4 GHz (C). The background images were transformed by equalization and softened with a 30 ″ window. White contours (panel a) show depressions with 0.7t levelsQs and 0.9tQs. The yellow contours show the EUV depressions at the 0.5 level of the middle brightness of the SDO/AIA image in the 211 Å line. Panel B is an EUV image on the 211 Å channel. The brightness is trimmed from above to 0.6 of the average brightness on the disc to highlight the structures within the CH. The D panel has longitudinal field magnetograms transformed by equalization and softened with a 30 ″ window. The red lines indicate the cross section to build shine temperature profiles in Figure 2. The squares denote the regions for which radio brightness histograms were analyzed.
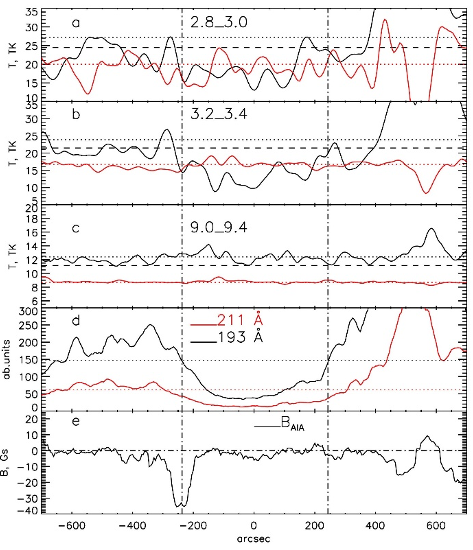
Figure 2. Brile temperature profiles in intensity (R+L, continuous black line; RL, Red continuous line) (AC), drawn along the transverse sections of solar disk represented in figures 1. Sun levels quiet tQs0.9tQs0.7tQs. The D panel portrays the brightness profiles in lines 211 and 193 Å. The vertical lines of points in all panels are the lim limits determined by the emission of EUV in the 193 Å channel; The black and red dotted lines correspond to half the brightness in the corresponding channel. All profiles are softened through a 30 ″ window. Panel E presents the SDO/HMI magnetogram profile.
In Figure 3 we can see the microwave spectrum the event of April 25 (asterisks). The vertical bars show the limits of the pixel’s brightness dispersions inside the square boxes in Figure 1. also show spectra of the quiet sun and two chs on September 23.
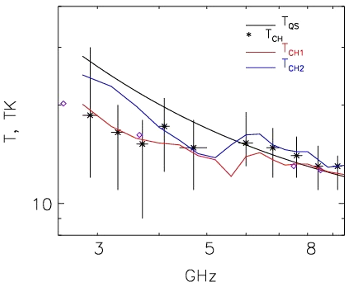
Figure 3. Radio emission spectrum of the quiet sunQs (continuous line) and averaged brightness temperatures on CH. Asterisks with bars indicate the spectrum of April 25, 2023 Cap. The bars show tmaximum YTminimum Inside the square ch. Diamonds Lilac Mark Ratan-600 measurements [Borovik et al., 1990]. The red and blue curves are the average brightness temperatures recorded in two CHS on September 20, 2023.
Discussion and conclusion
Radio SRH maps allow us to confirm with confidence radio brightness associated with CHS. In form and size, the EUV emission depression regions are the closest to those of microwaves with brightness of approximately 0.7TQs at frequencies ~ 3–4 GHz. Daily observations with SRH can be used, similar to extra atmospheric EUV images, to identify CHS on the solar disc.
Test observations with the Heliograph of the Siberian radio have confirmed the results of the CH OBSERVATIONS Obtained from the MultiWave Unidimensional Scanns of the Maps of Ratan-600 and two-dimensional SSRT (5.7 GHz) and the Heliography radio of Nobeyama (17 GHz) .
From Figure 1 it follows that reduced brightness structures with scales> 100“ It can be traced in the microwave range of 2.8 to 10 GHz. These structures do not clearly correlate with the distribution of the longitudinal magnetic field component. There are almost no spatial heterogeneities marked in the emission of EUV (see Figure 2). Pixel to pixel analysis of the shine temperature in CH shows the presence of small -scale heterogeneities (several arcsec). Pixel to pixel shine dispersions at a frequency of 2.8 GHz reach Tmaximum/Tminimum= 2.5, and with the growing frequency decreases to 1.3 to ~ 10 GHz.
The depressions are manifested at low frequencies, in which the contribution of the coronal layer is large and is attributed to ~ 1.5 times the lowest density and temperature of plasma in the crown above the CH in relation to the quiet sun [Borovik et al., 1999].
Bremsstrahlung’s mechanism of Bremsstrahlung generates the quiet sun’s microwave radiation and the CHS and consists, in the first approach, two -layer radiation: the optically thick chromosphere and the optically thin crown. Depressions are manifested at low frequencies, in which the contribution of the coronal layer is large and is attributed to ~ 1.5 times the lowest density and temperature of plasma in the crown above the CH in relation to the quiet sun [Borovik et al., 1999].
The test observations of the coronal holes with two antenna matrices in ranges of 3 to 6 and 6-12 GHz have demonstrated the high potential diagnosis of the radiography of Siberian radio. Spectral observations with SRH will provide unique information about the dynamics and structure of the solar atmosphere on CHS from the chromosphere to the lower crown, as well as the physical nature of heterogeneities within CHS, including the characteristics of the distribution of the magnetic field .
The use of the regular mapping of the solar disk in applied problems with the prognosis of solar wind variations is promising. SRH observations can provide the main CH parameters used in the prognosis (location and form of depression, depression depth, flashes activity in the limits of CH, heterogeneities of brightness in CH), which are currently obtained from observations EUV emission extra atmospheric.
Based on the recent article: Altyntsev, AT, Globa MV, Meshalkina, NS, Sych ra Observations of coronal holes with the Siberian radio heliography: 2024, solar-terrestrial physics, 10 (3), p.3-10, doi: 10.12737/STP-103202401.
*Complete list of authors: Altyntsev1In, globa1MV, Meshalkina1NS, Sych1Ra
1Institute of Solar-Terrestrial Physics SB RAS, Lermontov St. 126a, Irkutsk 664033, Russia
References
- Altyntsevt., Lesovoi Sv, Globa MV et al.: Solar-Terr. Phys., 2020, 6 (2), 30.
- Borovikn., Kurbanov MS, Livshits Ma et al.: Soviet Astronomy, 1990, 34 (5), 522.
- Borovik vn, Medar VG, Korzhavin An: Latvian. 1999, 25 (4), 250.
#Observations #coronal #holes #Siberian #radio #heliographer #Altyntsev #European #astronomer #radio #community