")


The temperature limits of the Paris Agreement are a bit ambiguous and knowing where we are is complicated.
He desire Keeping global temperature increases since pre-industrial times, ideally below 1.5°C and definitely below 2.0°C, is a bit complicated by the lack of definition of what constitutes the pre-industrial era, uncertainties about what the temperature was in pre-industrial times, and ambiguity in what is considered exceeding these limits.
These are old questions that were addressed in previous IPCC reports (SR15 and AR6), but there are new elements that have entered the equation since then and of course the real world has come close to exceeding 1.5ºC, so there is additional importance. There is a lot of collective effort going on to provide some clarity on these broader questions (which have just been presented), but I thought it would be interesting to review some of the more technical questions here.
First of all, when is “pre-industrial”? In reality, it cannot be defined from history without going back to periods when we did not have any (or many) instrumental data and, as we have discussed, anthropogenic impacts on climate could date back to the dawn of agriculture. So, for practical reasons, people have decided to consider the 19th century “close enough.” But even there we have problems. The early 19th century was abnormally cold due to a series of large volcanoes (including Tambora in 1815), so it should not be included if anthropogenic changes are to be highlighted. In any case, the instrumental data sets for temperature are mostly only valid for the global mean (with some relevant uncertainties) from 1850 onwards (although there are some good efforts to push this back further, e.g. Lundstad et al. (2025)). And since it takes a few decades to smooth out the internal variability, people have been using several multi-decade averages in that time. While there are still some holdouts, most people have followed the IPCC’s lead and now use the period 1850-1900 as a reference point for “pre-industrial” in practice.
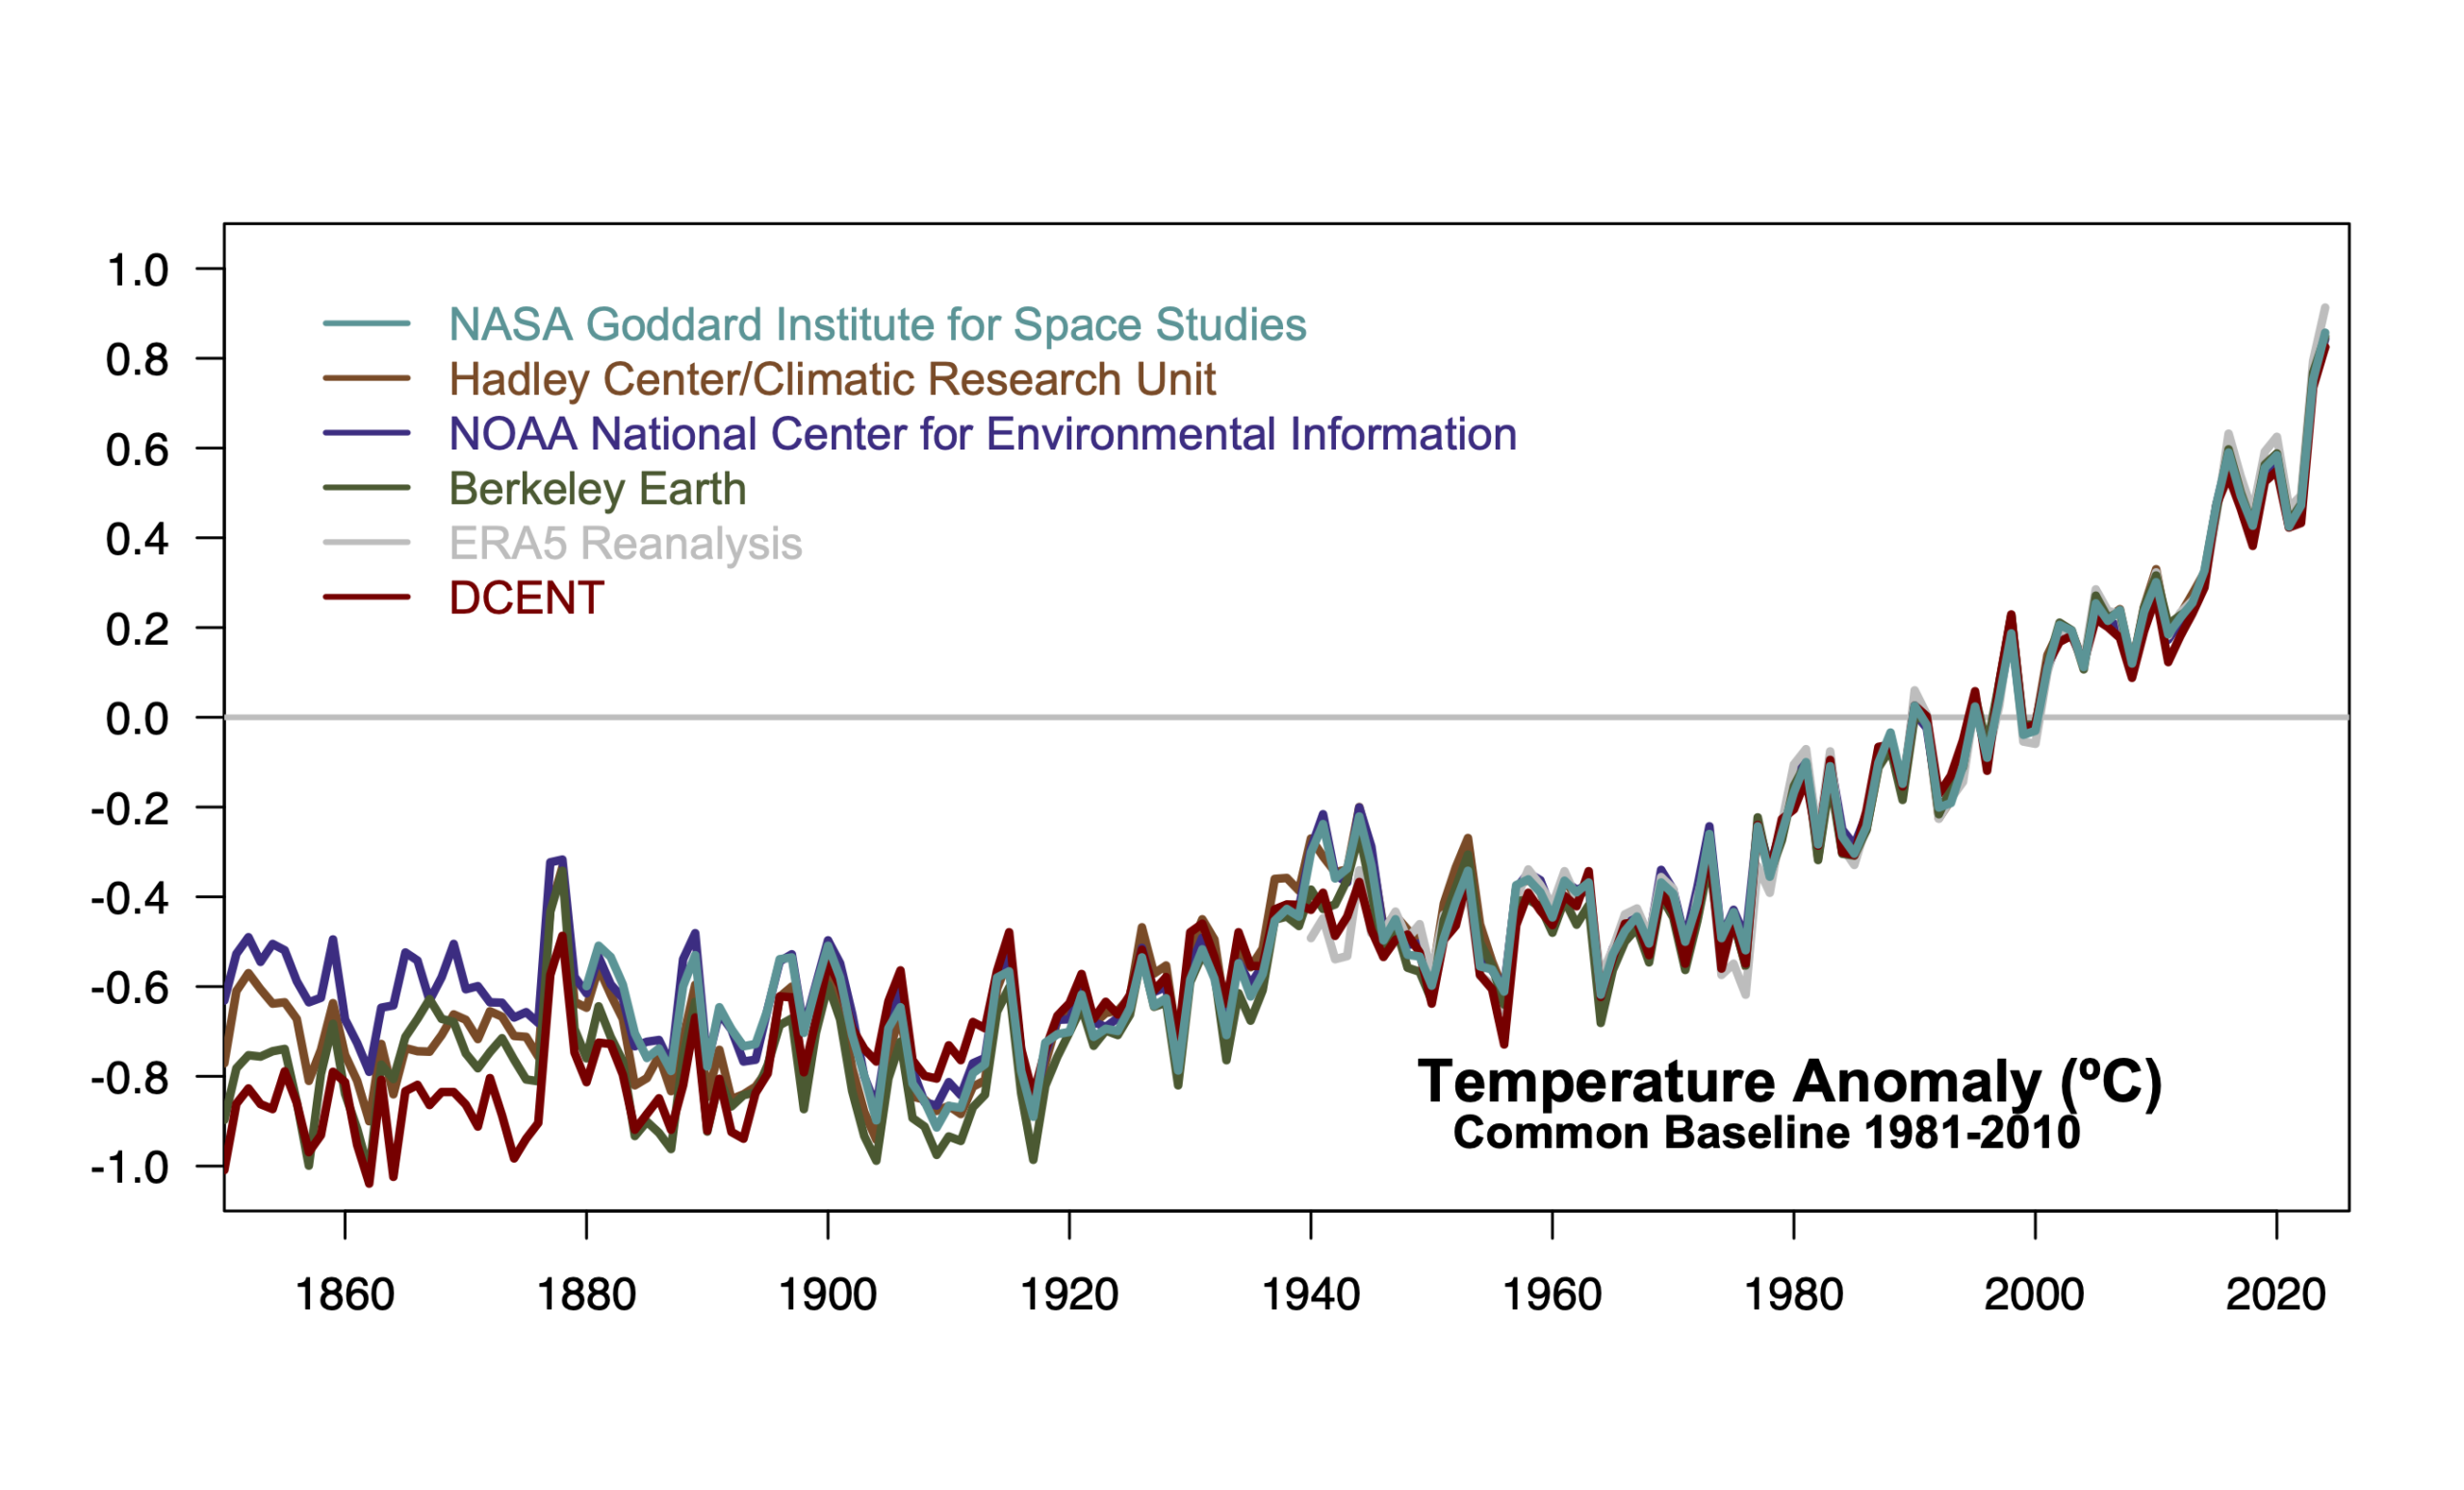
There are currently at least four regularly maintained data sets dating back to at least 1850: HadCRUT (currently v5.1), NOAA (v6), Berkeley Land and, a relatively new effort, DCENTO. They use different (although overlapping) raw data, different methods and different interpolations and therefore (unsurprisingly) give different magnitudes of change from 1850-1900. Relative to its own baselines, 2024 was 1.45-1.65ºC above 1850-1900. If they are aligned in the modern period (when differences between methods/data are minimal), there is clearly variation in both the inferred interannual variability and the mean change in the “pre-industrial” period (see figure 1). How should this be interpreted? This is not the full structural uncertainty (as we are not actually sampling all subjects, particularly in SST products), but perhaps it is a lower bound on that uncertainty. Of course, ensembles that sample methodological uncertainty are also useful.

Other data sets such as GISTEMP or JMA, or more modern reanalyses (ERA5, JRA-3Q, etc.) that do not go back that far, may still be useful because they contribute to our understanding of structural uncertainty in the periods where they overlap. He WMO uses a combination of these records (in 2024 it used an average of HadCRUT, NOAA, Berkeley, GISTEMP, JMA-3Q and ERA5) when available to create a composite record. But how do we achieve change from the pre-industrial era?
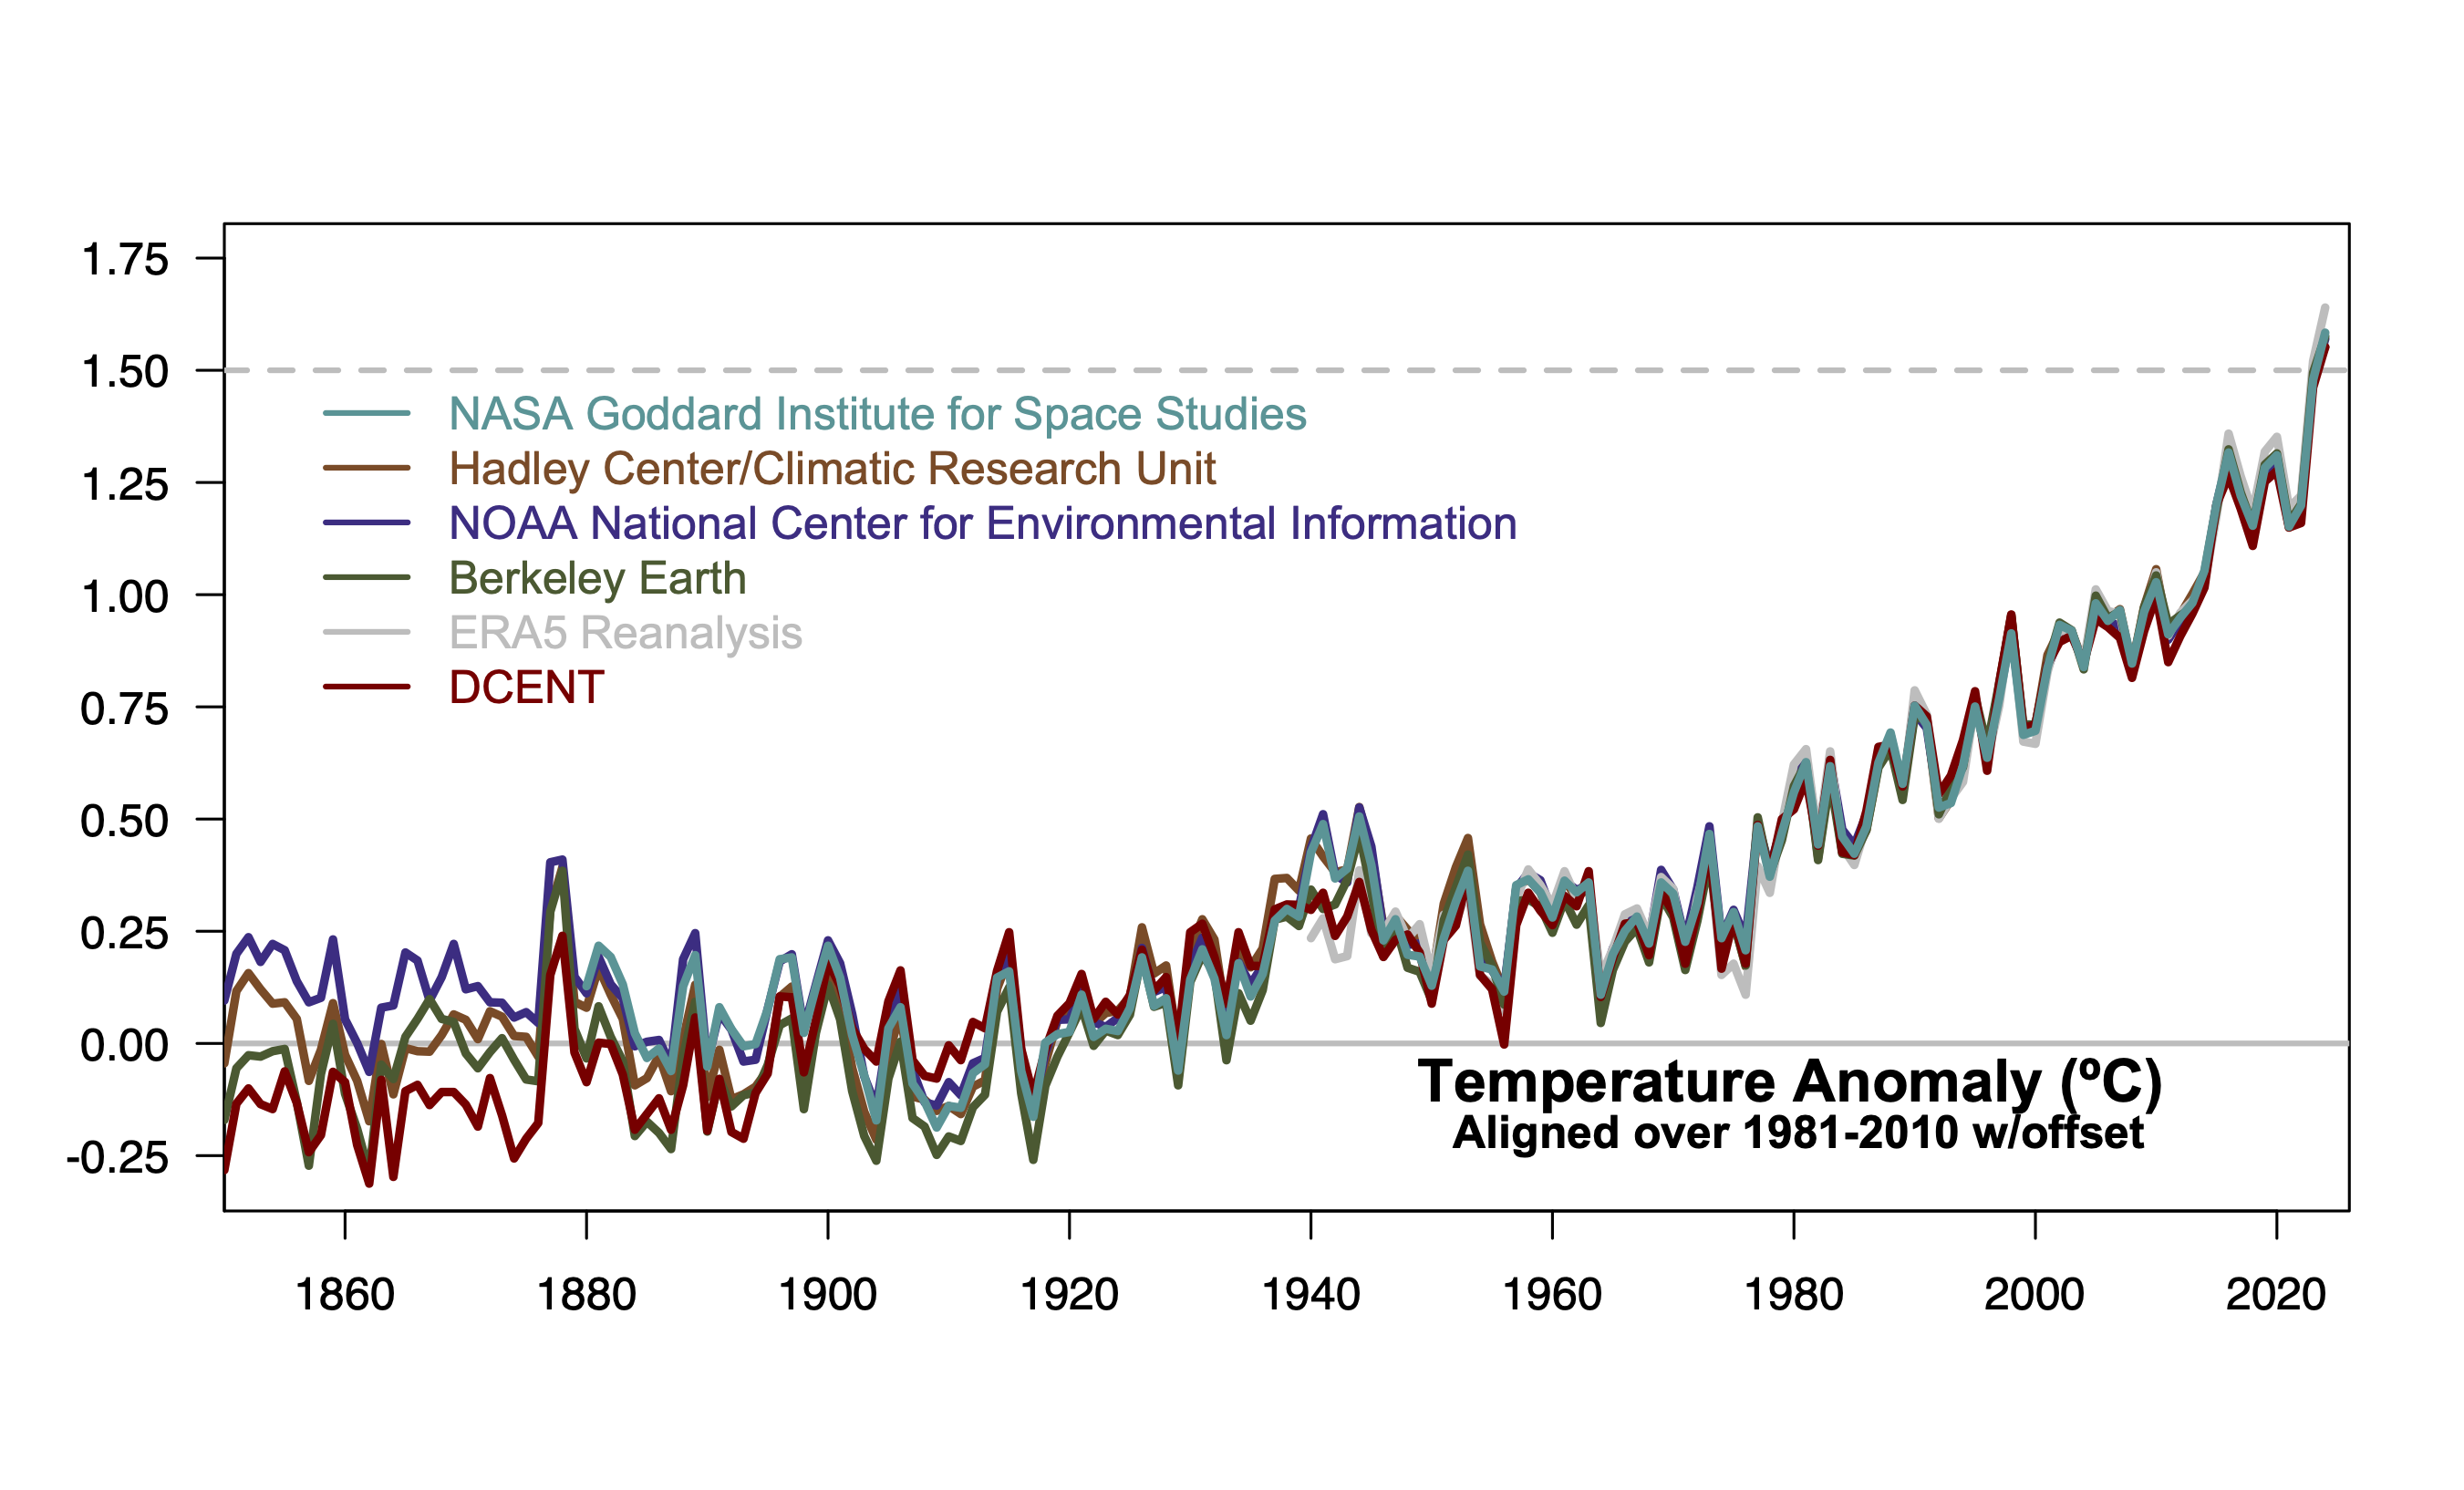
As we discussed earlier this year, one way would be to compare each long record with its own data from 1850-1900 and then aggregate the shorter records by linking them to a master record (but which one?) or to an average of the longer ones. However, if this is plotted, it appears that all the uncertainty occurs in the modern period. Using a modern period to cross-calibrate the different records (as in figure 1) but then imposing a constant offset to translate from modern to pre-industrial allows uncertainty to be clearly associated with the past (not the present) (as in figure 2). But how should compensation be calculated? We could assume that the average of the four long records should be zero during the preindustrial period or that the WMO average should be zero (or even something else entirely).
How much does this matter?
First, the basic question. Regarding 1850-1900, using an average of the 4 records mentioned above, 1880-1900 is 0.01ºC colder and 1880-1920 (which Jim Hansen uses) is ~0.02ºC colder. These are small numbers on average, but the spread between the 4 records is large (±0.08ºC), indicating that this is not very robust and could change in the future. Second, the difference between setting the WMO average to zero, or the average of the 4 long records, or the average of the records used in AR6, can make a difference of ~0.04ºC.
For individual months, there is a secondary question: should you adjust the climatological baseline annually or monthly? Each month has warmed differently since the 19th century (January/February/March have warmed about 0.17ºC more than July/August/September). That is, do you consider the October anomaly in relation to the climatological October (which seems sensible) or to the climatological annual mean? (which is a little easier). For Berkeley Land, October 2025 was 1.52º above pre-industrial Octobers, or 1.57ºC above if established as a base annually. The winter months are affected in the opposite way. Depending on the month it is an effect of ±0.08ºC. Note that this is only an issue for monthly anomalies related to a different baseline than the native (usually modern) baseline for any particular product.
Finally, since all of these approaches rely on moving targets (what records are kept, raw data being added through data rescue efforts, method version updates, etc.), one has the option of updating these calculations each year (which means explaining why things might change from previous years) or sticking to a canonical calculation (like the one in AR6) to maintain consistency. The best estimate of the annual offset from 1981-2010 to the period 1850-1900 was estimated at 0.69ºC in AR6, but following an analogous recipe would now give 0.73ºC (mainly because DCENT is 19°C cooler than the older products, and updates to HadCRUT and Berkeley Earth have changed things slightly).
The offset to link the shortest records to the longest also varies over time if the same method is maintained. For GISTEMP, I have been calibrating with other records during the period 1880-1900. Last year, that gave an offset of -0.028ºC to go from 1880-1900 to 1850-1900, but this year (with the addition of DCENT and minor updates to the raw data), it gives an offset of -0.01ºC. Copernicus uses a fixed compensation of 0.88ºC (of AR6) to go from a 1991-2020 baseline in ERA5 to 1850-1900, but following an analogous recipe and adding DCENT, you would end up with 0.92ºC.
Last year was the first in which we “probably” exceeded 1.5ºC in the annual average (the WMO average was 1.55ºC), and the uncertainty evaluated in this (derived from all the issues mentioned) is approximately ±0.13ºC (90% CI). With updates to the records, the WMO average would now be 1.54ºC. But if an offset is added to the 1981-2010 reference data so that the average of the four long records is zero, 2024 would be at 1.58ºC. Adding an offset so that the WMO average was zero above the baseline brings us back to 1.54ºC.
We have been exceeding 1.5ºC on a monthly basis in individual records (briefly) since the 2016 El Niño event (perhaps 2017 and 2019, and then again in 2020). Since 2023, we have exceeded it monthly more frequently and that has continued in 2024 and 2025 (chart 3).

Knowing when we have exceeded the limit with respect to a long-term average becomes more complicated again, except in retrospect. If we want to know if we have passed the midpoint of the first twenty-year period above the threshold, that means making some forecasts for the next ten years, which increases the uncertainties. We have many forecasts (from CMIP, initialized projections, statistical fits, and even machine learning), but there are many uncertainties (in the projected forcings, the structure of the fit, the adequacy of the training data). So this will also be something that will be subject to (annual?) review, and the precise answer may not be available for a while. It’s not obvious to me whether it matters whether it turns out (in a decade or so) to have been 2028 or 2030 or some other year.
Summary
There are some irreducible uncertainties in defining where we are relative to the pre-industrial era at any given time (day, month, year, decade), so one should not expect to know this precisely, and can expect a bit of “jitteriness” in assessments. Right now, as we hover around the 1.5ºC level, differences in method may move the value slightly above or below the threshold, but it should be understood that these jitters are not scientifically significant. Long-term trends are.
References
-
E. Lundstad, Y. Brugnara, D. Pappert, J. Kopp, E. Samakinwa, A. Hürzeler, A. Andersson, B. Chimani, R. Cornes, G. Demarée, J. Filipiak, L. Gates, GL Ives, JM Jones, S. Jourdain, A. Kiss, SE Nicholson, R. Przybylak, P. Jones, D. Rousseau, B. Tinz, FS Rodrigo, S. Grab, F. Domínguez-Castro, V. Slonosky, J. Cooper, M. Brunet and S. Brönnimann, “The HCLIM global historical climate database”, Scientific datavol. 10, 2023. http://dx.doi.org/10.1038/s41597-022-01919-w
#RealClimate #1.5ºC